
The short answer is understand your potential customer's online journey. And first step in understanding that journey is data. The best tool for the job? Google Analytics. In this post, we'll go through the basics of Google Analytics and explain how all that data can help you achieve your goals. Google Analytics is the gold standard in basic tracking, monitoring and analysing your website traffic. Analytics can give you a wealth of information detailing:
1. How much traffic is coming to your website.
2. Where the traffic is coming from.
3. What your patrons are doing once they are on the site.
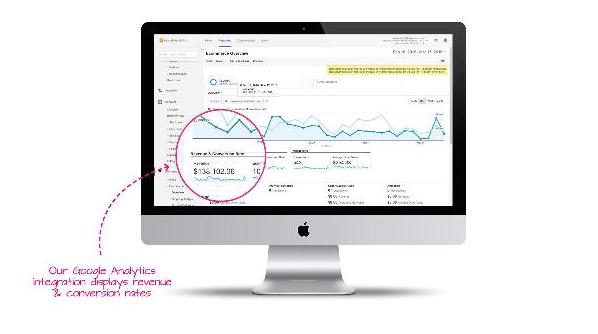
4. What is your online conversion rate(Google Tag Manager Integration- explained in a later post)
There are of course other tools you can use, but Analytics is one of the best free tools you can use to get started in analysing your customers online habits. Start off with the basics and then you can add on tools as you need them.
How does Google Analytics work?
Analytics works by tracking ‘tags’ (NB: different to Ticketsolve’s Tags), which are a small piece of JavaScript code that needs to be installed on every page of your website in order for Analytics to work properly (unless you are particularly web development savvy, you might need a web developer to help implement this step). This data is then collated and shown in a ‘report’ page in the Google Analytics’ admin interface. If you have multiple sites to manage, you can set up multiple reports for multiple websites within your main admin account. This allows you to track and analyse all your sites from one place.
What do all the numbers mean to your organisation?
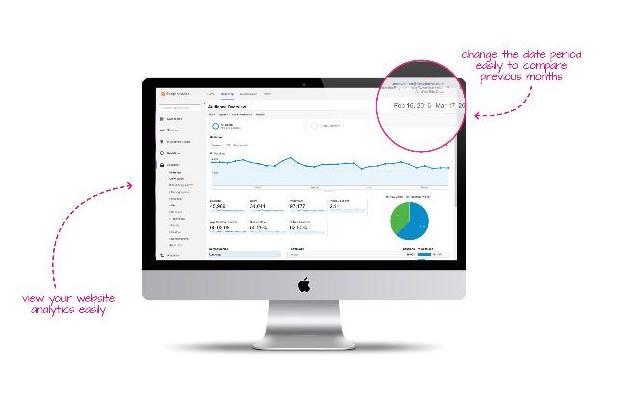
There are a lot of data points at play within the main report on Google Analytics. Below is a breakdown of the main data to be aware of, and what they mean. Visits: This figure gives you the total number of visits in a selected time period. Note that this figure includes both new and returning patrons. So a returning visitor would be counted twice or more in this number, and so “visits” is a different measurement to “absolute unique visits”. Unique visits is a truer indication of site traffic.
Page Views: This figure gives you the total number of pages viewed in the selected time range, one page view is considered as a bounce (see more about bounces below).
Pages Per Visit: This gives us the average number of pages viewed per visit - i.e., number of page views divided by the number of visits within the selected time range - usually a number is between 4 and 7.
However, this is quite a murky metric. It is not necessarily a good thing if visitors have to look at a lot of pages before getting where they want to, nor is it good if they leave the site after only two clicks. This is where we can make the customer journey simpler, cleaner (and less murky for our metrics) with a clear “Call to Action” e.g., BOOK NOW.
The Site Overlay: This is a great visualisation tool for usability enhancement, and can really help to influence decisions in terms of the ordering of content, and “book” button placement to drive ticket sales. This metric is really about where your visitors spend most of their time when they visit your site.
Top Landing Pages: Landing pages are just that - the pages your visitors “land on” when visiting your site. From a marketing perspective, there are different types of landing pages you can create to generate different types of traffic (more on that in a later blog post). This data point allows you to identify and track the effectiveness of the landing pages that are bringing traffic to your site.
Top Exit Pages: Where customer exit is also important to help identify pages that fail to convince, or do not encourage patrons to stay within the site. If your organisation has a very varied programme this metric can be a little tricky.
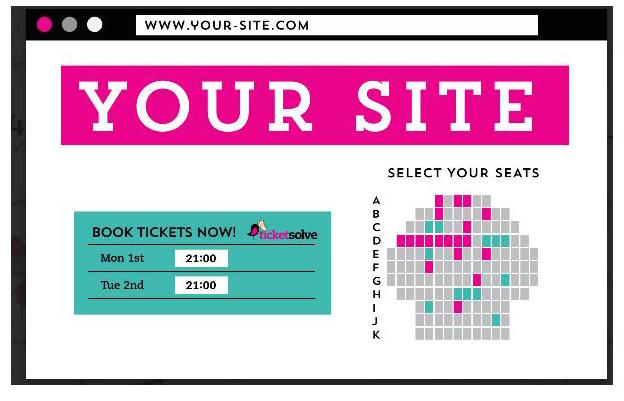
Goals and Conversions: This is one of the core concepts behind Analytics. A ‘Conversion’ is the completion process on a website, in other words the key actions that you want your visitors to take once they are on your site. In Analytics this is referred to as a ‘Goal’, and in many cases websites will have multiple goals or conversion points like buying a ticket/membership/product making a donation etc, signing up to a venue's newsletter.
Bounce Rate: Ever gone to a site and left straight away, never clicking to second page? That is a bounce, and the bounce rate gives you the percentage of visitors who leave your site without viewing a second page, i.e., they click the ‘back’ button, type a new URL, close the window or session time-out (usually 30 minutes). A good bounce rate is below 20%, 30% is pretty standard, and anywhere over 50% would suggest a close look is needed to why so many people are leaving the site on first glance.
Average time on site: Similarly to pages per visit, this metrics gives you a sense of time spent on your site. A longer or shorter time depends on the website’s goals. Expect anywhere between 2 and 10 minutes on average.
Search Engines: There are two options here: paid (search engine advertising or PPC) and non-paid (organic) search traffic. Non-paid or organic takes time, but is free. PPC is certainly faster but costs money. Which to chose depends a lot on your budget, and the time you can allocate to managing a campaign.
Direct Traffic: This metric shows the number of people who typed your URL directly into their web browser, often indicative of offline campaigns or returning visitors. e.g., www.ticketsolve.com This is a basic overview of the data you will find in analytics. Now we need to look at how we can use this information to improve our website and increase online sales and conversions.
How do we use Analytics for improving our website?
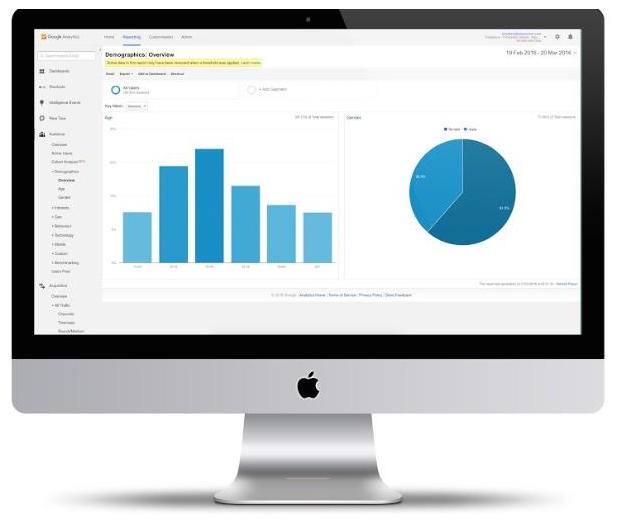
Once you have the basic data in play it is time to dig deeper. The Content tab allows you to understand how people are really using your site, and what content is most engaging. It shows you demographic information, which pages are the most popular, and how people’s journeys progress from page to page. Below is further breakdown of the data you will find here.
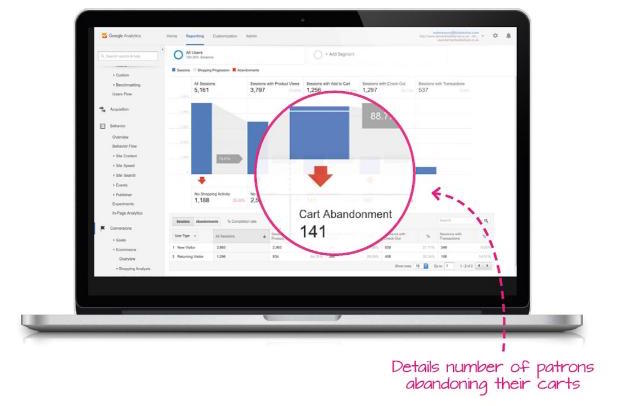
Funnel visualisation: This is a very useful tool to look at conversion and form sign-up processes, this tool is very useful for identifying the potential problem pages in a step-by-step process that needs tweaking. This in conjunction with AB testing and face to face user testing is the optimum method of improving conversion rates.
So to summarise, Google Analytics is an awesome must have tool, that allows us to accurately measure the performance of a website, and means that a web strategy should be constantly evolving, tweaking both traffic strategy and our conversion processes to optimise the site.