
At Ticketsolve we are big advocates of Google Analytics as it gives you really powerful data that you can actually use to sell more tickets. Because of this, we have built an in-depth integration with Google Analytics (I’ll call it GA from now on as it's a long word to keep typing!) that allows our customers to really understand how their customers interact with their website.
The Main Stat
94% of people who use GA only look at the first report which is the Audience report. This report shows how many people visited the website, how long they were there for and other ‘visit’ related data. Okay, don’t look that 94% stat up - I might have pulled that number out of the air :) But it is a REALLY high percentage of people that only look at the audience report and move on.
The point is you need to start looking at the more juicy stuff, and it doesn't get much juicier than the e-commerce conversion rate!!
This is the first stat you should be looking at. It gives you a real indication as to how many people are purchasing tickets on your website. A lot of venues don’t have the capability of looking at this stat as their current box office system hasn’t got a full integration with GA, but don’t worry, Ticketsolve has you covered! ;)
So, what is the e-commerce conversion rate? Basically, it is the percentage of people who come onto your website and end up buying a ticket. According to Blacktype Digital and Google Partners, the average conversion rate in the ticketing industry is 1-2%. So that means for every 100 people who come onto your site, only 1 or 2 people will end up buying a ticket.
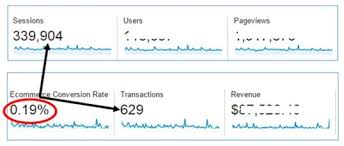
You compare that to our customers’ averages and it is mindblowing. For some of our customers, their conversion rates are over 6%. This shows that their website combined with the Ticketsolve booking journey works very effectively and is really efficient.
Enhanced Ecommerce

Staying with e-commerce for the moment, the enhanced e-commerce data you can get from GA is brilliant. Helped by the groundwork of our developers, the enhanced data is fantastic as it can show you how the customer moves through the booking journey. The graph below shows how customers come onto the website, and move through the booking funnel to finally purchasing their tickets. The main stat we are looking for within this report is the cart abandonment rate - this is the number of people that leave the purchasing flow after they have added tickets to their cart. The average drop off rate is around 78% however, in our industry this will be slightly lower. Some of our customers see their drop off rates as low as 25% and this again shows the simple booking process that Ticketsolve has really works.
Where Are My Customers Coming From?
Another great report, especially for the marketing teams is the Acquisition report. This will show you where your customers are coming from - e.g. Facebook Campaigns, Google Search, Twitter Links, etc. But, because we have a full enhanced integration with GA, you will also be able to see how much revenue has been generated from each of those locations. Cool, eh! If you use MailChimp, this also has an e-commerce integration with GA, so when you send your emails out, they are automatically added as a campaign in GA so that you can track exactly how successful it is.
Top Tip: Check out our blog on Google Url Builder for you to track all digital marketing campaigns.
What Are My Customers Using?

A very good data point to look at is how customers are visiting your website and what devices they use to purchase their ticket. The mobile report shows you exactly that, how many people visit your website using a mobile, and more importantly how much revenue is being spent on each device. In the next year or so, we envisage that 80% of all online sales will be made on mobile. Some of our customers are already seeing their mobile sales accounting for 70% in some areas. Again, this shows that because Ticketsolve is responsive, the purchasing journey for customers is seamless; they are not faced with obstacles or frustration when trying to make bookings on mobile.
Demographics
Demographics in GA is a hidden gem in our eyes. Google can tell you (quite accurately) the demographics of customers visiting your website. When looking at it for ‘all customers’ it is good data to have. But when you delve deeper and look at specific segments such as ‘everyone who purchased for a comedy show’, it’s great data! Couple that info with how customers are purchasing on PC, mobile and tablet, and you can really start to adapt your digital strategies around these data points.
Summary
We hope you’ve found this blog useful and that you will start looking at these data points in more detail from now on. In summary, the reports that we think you should be looking at in detail are:
-
E-commerce Conversion Rates
-
Enhanced E-commerce Shopping Behaviour
-
Acquisition by Source and Medium
-
Device Category
-
Demographics
You will probably begin looking at these reports as a whole, with all your customers in the segment, but it is good practice to start using segments so that you see how certain demographics interact with your website. All this information can then be brought into your digital marketing strategy and will start to drive your goals and objectives, and more importantly, will increase your ticket sales.